No.
Next!
…
Ok, fine.
The Guardian article from which that headline is taken is reporting on this journal article.
I have some problems with it.
Background
The article has a fairly simple design: it compares the rate at which people with low LDL cholesterol (<70 mg/dL) and high LDL cholesterol (>130 mg/dL) are diagnosed with dementia.
The results were similarly simple: people with low LDL cholesterol were diagnosed with dementia less frequently than people with high LDL cholesterol, hence the “cut risk of dementia by 26%” claim in the Guardian title.
I’ll get into the methods in more detail in a bit, but first, the most aggravating problem.
Problem 1: the study didn’t look at risk
The journal article didn’t look at risk, it looked at hazards. The effect estimate of interest came from a Cox proportional hazards regression, meaning the effect estimate was a hazard ratio of 0.74 (95% CI 0.67 to 0.77), which IS NOT THE SAME THING AS A RELATIVE RISK REDUCTION OF 26%.
It’s a hazard reduction of 26%.
Which no one ever says because no one would understand what it meant in practice.
I’ve seen this so many damn times.
Even in evidence synthesis, I’ve seen people combine relative risks, odds ratios, and hazard ratios in the same meta-analysis. It’s statistically illiterate: they are not the same thing, and they cannot be combined as if they were. There’s some merit to the argument that odds ratios approximate risk ratios under certain conditions, but in practice, they probably shouldn’t be combined.
There’s no similar argument for hazard ratios, they are an entirely separate thing.
You’ll likely have heard of meta-analyses that compare apples to oranges, as in, the studies are too different to meaninfully compare. Including odds ratios, risk ratios, and hazard ratios in the same meta-analysis is like comparing apples to oranges to aardvarks.
For those unfamiliar with them, hazard ratios are what you get when you divide one hazard by another: that is, a ratio of hazards.
What’s a hazard? Good question.
The hazard function describes the rate an event happens, given the event hasn’t already occurred.
There’s an element of time that isn’t present in either odds ratios or risk ratios.
A Cox proportional hazards ratio is estimated with the following formula (sort of):

h0(t) is the baseline hazard function, and it’s multiplied by e to the power of the sum of the product of some predictor variables (if present) and the variable of interest (beta).
Probably: I’m not an expert in survival curves and hazards. Primer here.
Point is, this looks nothing like the equations for odds ratios or risk ratios (ok, it looks a little like them, but time isn’t included in either).
They’re not the same.
If you need more evidence, this is a graph from the primer:

The risk ratio would be the risk of the event happening on diet 2 divided by the risk of the event happening on diet 1. Which is different at every single time point. There isn’t one risk ratio: if a study reports one risk ratio, it’s almost certainly the risk ratio seen at the end of the study, and everyone made it to the end of the study (that is, they didn’t die, unless dying is the outcome of interest, or leave the study).
But I guarantee that, barring extremely weird circumstances, if you calculated the risk ratio at any other timepoint, you’d get a different answer.
The hazard ratio is effectively one curve divided by another. There’s only ever one hazard ratio in a survival analysis. One hazard ratio gives rise to many different risk ratios (even a hazard ratio of 1 is likely to give rise to different risk ratios, though they’ll likely be close to 1).
It’s why I was flippant at the start of this: does lowering bad cholesterol cut the risk of dementia by 26%?
No.
The hazard may be reduced by 26% (though again, no one says that), but that doesn’t mean the risk is reduced by 26%.
Ok, so what is the relative risk reduction in this study?
The answer is: it’s impossible to tell. The hazard ratio is from a meta-analysis: there are survival curves for individual cohort studies, but not overall.
Nonetheless, we can do something to get an idea.
This is the survival curve for the first cohort study (AUMC), which had a hazard ratio of 0.73 (so pretty damn close to the pooled hazard ratio):

Let’s compare the prevalence of dementia at 1000 days, 2000 days, 3000 days, and the final timepoint. “Survival” here means “survival without being diagnosed with dementia”. The red line is, I think, high cholesterol, and the blue line is low cholesterol: this would mean dementia is more common with high cholesterol, which is what the results show. It sounds right, but I’d have preferred the figure to say so I didn’t have to guess.
I extracted the data below using plotdigitizer.com – a great site for this kind of thing. I set the X and Y axes, then selected points from each line at 1000 days, 2000 days, 3000 days, and study end. Voila.
| Time point | Low cholesterol risk | High cholesterol risk | Risk ratio | Relative risk reduction |
| 1000 days | 0.0036 | 0.0046 | 0.78 | 22% |
| 2000 days | 0.0062 | 0.0101 | 0.61 | 39% |
| 3000 days | 0.0108 | 0.0161 | 0.67 | 33% |
| Study end | 0.0157 | 0.0250 | 0.63 | 37% |
See how the relative risk reduction changes over time? It’s just what happens. It’s fine.
The risk ratios are very different from the hazard ratio. You know, because they’re not the same thing at all.
Anyway, this was just one of the cohorts involved in the study: you’d get different risk ratios from each of them.
I think it serves the point though: hazard ratios are not relative risk reductions, and they shouldn’t be used interchangably.
Similarly, I wouldn’t like armadillo juice.
Problem 2: who are the people in these cohorts?
The participants of this study were from 11 different Korean cohort studies, with data from between 1986 and 2020.
In total, there were 12,233,274 people included in these cohorts, which was whittled down to 903,711 people who had measured LDL levels, followed for at least 180 days, and didn’t have Alzhemier’s disease before cohort entry.
These 903,711 people were whittled down again:
- 170,174 people were excluded because they had, I think (?), both high AND low cholesterol measurements (this is weird as only the first LDL measurement is used)
- 3,378 people who had a “previous history of Alzheimer’s disease” (not sure why they weren’t excluded above, but ok)
- 158,940 people who had at least 1 day of risk (um… not sure, guess these people had exactly 180 days of follow-up? It’s unclear)
This left 192,213 people with low cholesterol, and 379,006 people with high cholesterol.
The study then matched the people with low and high cholesterol, 1:1, to attempt some causal inference by reducing or removing confounding. More on that in a bit, but for now, simply know that after matching, there were 108,980 people with low cholesterol, and 180,980 people with high cholesterol.
So, we went from 12,233,274 people to 108,980 x2 people.
That’s 1.78% of the original sample.
That’s… Not good.
It’s highly selected. Maybe that’s not an issue: it’s not a guarantee that only including 1.78% of your sample will be problematic.
It’s just… It’s not good.
Oh, and also, important point when writing about a study in a national newspaper in the UK: people in Korea tend to be Korean (the paper didn’t specify ethnicity or race, which usually means there was no need).
This may affect the generalisability of the results to people in the UK.
In fact, I suspect it almost certainly will affect the generalisability of the results.
But there’s a bigger problem that who was in the cohorts.
Problem 3: matching
It’s important to say that matching is a perfectly fine way of creating more similarity between two or more groups when doing a statistical analysis. I’m fine with it.
There’s a big post on stats.stackexchange about matching vs regression by Noah: it’s great, take a look. But matching is not inherently problematic.
Except.
Except if the two groups you are matching are so wildly different, that you might expect that any amount of matching will not, in fact, make the two or more groups similar.
And the two groups of people with low and high cholesterol are two groups of people who are wildly, incompatibly different. One of the ways is obvious when thinking about LDL cholesterol and a massive problem in its own right, but we’ll come to that.
Age distributions of the two groups? People with low LDL are quite a bit older (also, notice the missing age group?):

Less likely to be female:

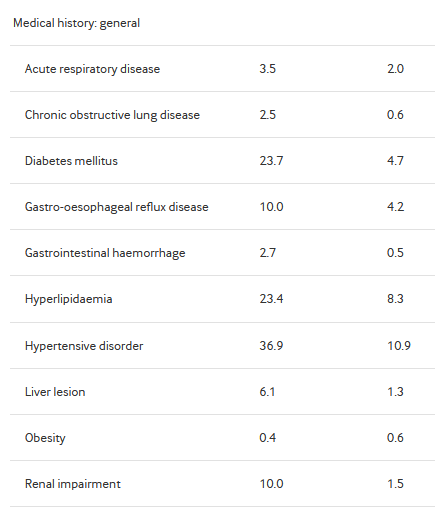
Much, much more likely to be sick:

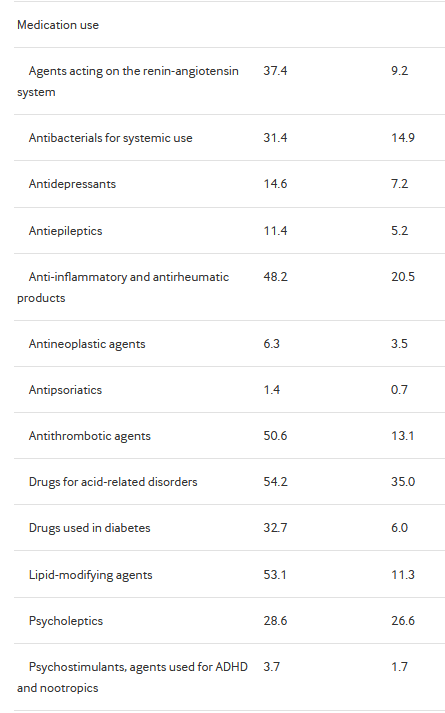
And much more likely to be on medication:
The table caps out there, but the study matches on thousands of variables. The paper says they matched on: “age, sex, index year, all recorded comorbidities, prescribed drugs within 365 days before the index date, smoking history, alcohol use, and Charlson comorbidity index.”
Note the lack of socioeconomic variables. You may be able to think of a tonne of other variables that are missing, that would be useful to include as potential or actual confounders.
But, suffice to say, given the observed differences, I would expect there to be a tonne of unobserved differences. And the unobserved differences are not matched for. They are still present. Messing up the analysis.
The low LDL group are clearly sicker. Like, properly sicker. All co-morbidities are more prevalent in this group. I mean, they’re older, so I guess that makes sense, but c’mon: 23.7% have diabetes, 36.9% have hypertension, 23.4% have lipidaemia (you know, for example, high LDL cholesterol…), 10.0% have renal impairment, 34.0% have heart disease, 8.8% have cancer.
They are not a healthy group.
And yet they have less dementia. Weird.
I mean, everyone started in these cohorts without dementia, it was part of the inclusion criteria, but still. You’d expect the sicker group to wind up being diagnosed more frequently with dementia, even accounting for the matching, given this group is clearly sicker.
I wonder if something they did in the analysis made it so this was always going to be the outcome…
Oh, and obesity rates are so low because this is Korea. If it were the UK, those rates would be way higher.
Anyway.
This problem isn’t really about the people (here, it was above), this problem is about the matching.
What matching does is select or weight people in each group so that the standardised mean difference between the two (or more) groups end up looking similar. So, in this case, it’ll select the older, sicker, less female, more medicated people from the high LDL group, and the younger, healthier, more female, less medicated people from the low LDL group, thereby making the groups more similar, allowing for better causal inference by reducing the effect of confounding from these variables.
As above, there’s no accounting for unobserved variables.
But what does that do for interpretation of the results?
We’re now not comparing peoplewith a low LDL with people with a high LDL.
After the matching took place, we ended up comparing, most likely, the more atypical people in each group.
I, in fact, can’t precisely say who we’re comparing.
And that’s a big problem by itself.
But the biggest problem with the matching, as I see it, is up next.
Problem 4: lipid-modifying agents
See the third from the bottom medication in the table?
Lipid-modifying agents.
Often, these will be statins. Taken to lower… LDL cholesterol.
Over half of the low LDL cholesterol group is taking them.
Only 11% of the high LDL cholesterol group is taking them.
This makes sense. I mean, if you take statins your LDL cholesterol goes down.
Not in everyone though. Some people don’t respond well, or maybe their cholesterol is just so high that, even taking a statin, their cholesterol is still high. Or maybe, they’ve been prescribed a statin, but don’t take it because it causes issues, so they just remain untreated. Could be deprivation related: almost everything is. Who knows.
But what does that matching do? It reduces the number of people taking lipid-modifying agents in the low LDL cholesterol group (down to 36.6%), and increases it in the high LDL cholesterol group (up to 39.7%):

The high LDL cholesterol group is now massively overrepresenting people who took lipid-modifying agents and still had high LDL cholesterol.
Who are these people?
Do we think there might be some bias coming in here, given we are literally matching on a drug that changes LDL cholesterol levels?
I certainly do.
It really seems like a crazy thing to do.
And it comes down to one of the issues with matching, talked about by Noah on stats.stackexchange:
“Your effect estimate may be unbiased, but unbiased for what?”
I don’t think it’s an unbiased estimate, but even if it were, who is the comparison now between? People who respond to statins vs people who don’t? People who take statins vs people who don’t? Rich people vs poor people? People who are much more likely to have co-morbidities vs people who aren’t, conditional on the co-morbidities everyone had at cohort entry?
It’s really unclear to whom the hazard ratio of 0.74 applies.
Problem 5: statin prescribing
Ok, so a risk reduction of 26% isn’t right.
And even if it were, I have no idea to whom it might apply.
The analysis was in a really selected population, and after matching, I have no idea about anything.
Half the low LDL cholesterol group are on lipid-modifying agents, and that seems like an issue too.
What else?
Well, the LDL cholesterol measurements were taken… Once.
For every person. It’s the first one that counts. So, if you’re on, say, statins, your history of having high LDL cholesterol is erased, and now you’re just in the low LDL cholesterol group. This seems like an issue.
Partly for the obvious reason that it really matters for this analysis what someone’s LDL cholesterol is over time, not just at one timepoint.
But partly, statin use is patterned by deprivation, which was not accounted for in the matching at all. The higher the deprivation, the lower the statin use. This may have changed in the UK, but of course, these cohorts go back to 1986, and I have no idea about Korea.
But the low LDL cholesterol group has high lipid-modifying agent use (in fact, twice as high as have hyperlipidaemia, compared to only slightly more for the high LDL cholesterol group), so I wouldn’t be surprised to learn their deprivation was far less than the high LDL cholesterol group. And, of course, deprivation leads to dementia (I’d use non-causal language here if I thought for a moment that deprivation didn’t outright cause dementia, and wasn’t just associated with it, although for our purposes here it doesn’t matter).
Also, why did people get their LDL cholesterol measured? That matters too! Most people in the low LDL cholesterol group clearly had their cholesterol measured before because they’re on statins!
The people in the high LDL cholesterol group may have had their first cholesterol test as part of the cohort study they were in. I have no idea, but it would explain why so few are on lipid-modifying agents despite having high LDL cholesterol.
And once they started taking statins, they’d have been like the LDL cholesterol group. Except we can’t know that, because only the first LDL cholesterol measurement mattered, and only medications taken before cohort entry mattered…
Ok… Anything else?
There are 3 other analyses, but I was so irritated by the rest of the paper I didn’t read them. Lazy, I know, but c’mon: I had to read the rest of the paper…
But, right, yes: causal inference.
Problem 6: causal inference
It is so tiring to have to say “correlation is not causation” all the time for shit like this.
But the headline of the article was “Lowering bad cholesterol may cut risk of dementia by 26%, study suggests”.
And the article does, in fairness to the article, say the same thing: “These findings support the necessity of targeted lipid management as a preventive strategy against dementia, indicating the importance of personalised treatment approaches.”
To be fair, I probably expected too much when the study says “26% reduction in the risk” when referring to a hazard ratio of 0.74.
But, for the record, no.
That’s not the conclusion we can draw from this evidence.
I can’t even come up with a valid statement for what the results show, because it’s so unclear.
Between the lipid-modifying agent differences, the participant selection, and the matching, I can’t come up with a precise and correct statement about to whom the hazard ratio applies. For all intents and purposes I can think of, it’s meaningless.
It’s certainly not “(Korean) people who were included in the 11 cohort studies in this study”, because the selection and matching moved well away from that.
And it is definitely not “people in the UK”.
But.
The Guardian’s first line reads: “Lowering your levels of bad cholesterol could reduce the risk of dementia by 26%, a study suggests”.
This is technically true, in the sense that the study did suggest it, and it could be 26% (it could be 72%, or -42%, I have no idea, and I would bet money no one else does for sure).
But it’s also statistically illiterate, conflates correlation and causation, and basically acts as PR for the study authors.
Basically, I’m tired of shit like this getting picked up by the media.
Problem 7: the results could be right!
The last problem is that, as far as I know, statins are good!
They could reduce dementia risk!
And studies like this (bad as they are), and media articles like that (irritating as they are), may reduce the risk of people developing dementia by getting more people to take statins!
It makes sense that a drug that reasonably effectively reduces the risk of vascular occlusion would help prevent a disease that can be, in part, caused by vascular occlusion. Particularly with our diets.
I can argue against the interpretation and presentation of the results all I like, but in the end, this may do more harm than good…
It’s a shitty place to be: good science is necessary for trust in scientists, and I believe calling out bad science is a necessary part of that.
It’s a similar place to be as years ago when I argued against a study that said the doctor who (reportedly) gene-edited babies could have increased their risk of a disease by doing so: the study methodology was wrong, but I wholeheartedly agreed with the idea that the doctor should absolutely not have gene edited babies.
I mean, holy shit, don’t fucking do that.
But also, and I really think it was worth spending an evening slamming all this down in this post: if the interpretation of an effect estimate is impossible to determine, it can’t possibly be useful.
So, no.
Lowering bad cholesterol almost certainly won’t cut risk of dementia by 26%.
It’d be nice if it did though…
